
Key Takeaways:
- California’s EPR law, SB 54, has set several ambitious goals for recycling and plastic source reduction rates that require additional action from producers.
- Producers must meet three source reduction targets across three target years: 10% by 2027, 20% by 2030, and 25% by 2032.
- There are five pathways by which producers can source reduce: reuse/refill, elimination, switching to non-plastic material, right-size/lightweight/concentration/bulk, and PCR.
- Within the total source reduction targets, there is a floor for reuse/refill/elimination (RRE) and a cap on PCR incorporation.
- Secondary and tertiary packaging provide some of the best opportunities for source reduction through relatively simple and cost-effective changes.
Most of the conversations around EPR stop at recycling rates and paying fees, but California is different. On top of the basic requirements and fees that we associate with an EPR law, California’s packaging EPR law, SB 54, has set several ambitious goals for recycling and source reduction rates that require additional action from producers. Not only does SB 54 mandate that all packaging must be recyclable or compostable by 2032, but it also requires a 25% reduction in the total amount of single-use plastic coming into the California market by 2032. In this Deep Dive, we’ll talk about this source reduction requirement, what it means for obligated producers in California, and how brands can best prepare for these additional actions.
California’s Source Reduction Requirements
As written in California’s EPR law, SB 54, plastic source reduction (SR) means reducing the total amount of single-use plastic that a producer supplies into California’s market. It is measured using two different metrics simultaneously: the total weight of all plastic covered materials, and the total number of plastic components. All producers must hit the percentage targets on each metric independently. This means that producers cannot achieve the targets through weight reduction alone–they must also meet the plastic component reduction target.
All SR under SB 54 is calculated against each producer’s own 2023 baseline supply data using a straightforward formula: subtract the plastic weight (or component count) supplied in the relevant data year from the 2023 baseline, divide by the baseline, and multiply by 100 to get a percentage. As mentioned previously, SB 54 sets an SR target of 25% by 2032, with two interim target years – 2027 and 2030 – that set incremental targets of 10% and 20% respectively. Each target is measured as of January 1st of the target year, using supply data from the prior calendar year. For example, producers must prove a 10% plastic source reduction by January 1st of 2027, using supply data from calendar year 2026 to prove the target has been met.
Within these overarching targets, there are two additional caveats – a certain percentage of producers’ total source reduction must come from reuse, refill, or elimination, and incorporation of post-consumer recycled (PCR) content can only count towards 8% of total source reduction. We’ll cover both of these in more detail later in this Deep Dive.
So far, California’s SR requirements haven’t been seen before in any of the other EPR legislation across the United States. This adds a unique challenge for companies who are considered obligated producers in California, especially considering there is no adjustment for sales growth – the requirement is absolute, not relative. This means that if producers grow their sales using plastic packaging, they must source reduce even more to meet targets. So what methods can producers use to meet these targets?
The Five Source Reduction Pathways
Circular Action Alliance (CAA), the producer responsibility organization (PRO) for SB 54, laid out five pathways through which producers can achieve their SR targets. Every reduction action that a producer takes maps to exactly one of these pathways; however, multiple “actions” may be taken on the same packaging design. Essentially, rather than having five strategies to choose from, there are five categories that every action will fall into:
- Pathway 1: Reuse/Refill
- Pathway 2: Elimination
- Pathway 3: Switching to non-plastic material
- Pathway 4: Right-sizing/lightweighting/concentrating/bulking
- Pathway 5: Using Post-Consumer Recycled (PCR) material
Pathway 1: Reuse/Refill
The first category is called “Reuse/Refill,” which is achieved by shifting single-use plastic packaging to qualifying reusable or refillable systems. This can be either producer-managed in the form of returnables, or consumer-managed through refill-at-home or refill-on-the-go programs. This is one of the most difficult pathways to implement as it requires investment in infrastructure, and all reuse/refill systems must meet specific design and durability criteria set by the law.
Pathway 2: Elimination
The second pathway is elimination, which involves removing plastic components entirely with no replacement. For example, you might remove a plastic label, plastic window, inner tray, or outer overwrap. This isn’t to be confused with the next pathway, switching to non-plastic material.
Pathway 3: Switching to Non-Plastic Material
In this scenario, rather than eliminating a component completely, you simply replace a plastic component with a non-plastic material. For example, you might replace a plastic clamshell with a fiber-based clamshell. It’s important to note that many “alternative plastics,” such as compostable or bio-based polymers, still count as “plastics” under California’s definition. In fact, California’s statutory definition of plastic explicitly includes PLA and other bio- polyesters. As such, transitioning to one of these alternatives likely won’t contribute to your overall source reduction goals.
Pathway 4: Right-size/Lightweight/Concentrate/Bulk
The fourth pathway is right-size/lightweight/concentrate/bulk. This category is a catch-all design pathway that provides the broadest array of options for incremental packaging improvements. In this pathway, producers can reduce plastic weight or components through thinner material, smaller formats, elimination of excess headspace, product concentration, or a shift to bulk or large-format packaging. Examples might include concentrating a laundry detergent formula so it can fit in a smaller container, or trying to sell products in bulk containers instead of single-serve.
Pathway 5: Post-Consumer Recycled (PCR) Material
The last pathway, which is technically considered an alternative compliance path, is the incorporation of post-consumer recycled (PCR) material. This simply means using PCR content as a substitute for virgin plastic. Because this is an alternative compliance path, there are multiple constraints on how producers can use it to reach their overall SR targets. First, only 8% of a producer’s total SR requirement can come from the inclusion of PCR. Additionally, only incremental PCR counts, meaning that PCR content that was incorporated into a producer’s packaging in 2023 is already baked into the baseline, so it cannot count towards source reduction targets. Only PCR added above the 2023 level is eligible for SR compliance credit.
On top of that, all PCR must be validated through the Association of Plastic Recycler’s (APR) Postconsumer Resin Certification program. And while this is really more of a technicality, the final regulations require CalRecycle to approve CAA’s alternative compliance formula as part of the PRO plan, which, as of this publication date, has not happened yet. This means that this pathway is technically not usable now, but we have no reason to believe that CalRecycle won’t approve it, and official approval is expected by January 2027.
Source Reduction Target Timeline & RRE Floor
As mentioned previously, there are three target years with incremental targets. Producers must meet SR rates of 10% by 2027, 20% by 2030, and 25% by 2032. We just reviewed the five pathways by which producers can meet these targets; however, not each of the five pathways count the same way every year.
SB 54 considers reuse and refill the gold standard for the five pathways. Because of that, the law built a floor within the total source reduction target requiring that a minimum portion of all source reduction must come from reuse/refill systems. This means that producers cannot hit the target purely by lightweighting and material switching–at least some incorporation of reuse/refill is required.
Just as there are interim target years with increasing rates for the total SR targets, the same is true for the reuse/refill minimum (see figure 1). Within the 10% SR target for 2027, at least 2% must come from the use of reuse/refill. For 2030, at least 4% of the total 20% target must come from reuse/refill. Lastly, in 2032, at least 10% of the 25% total SR target must come from either reuse/refill systems OR elimination. As you can see, in years 2027 and 2030, only reuse/refill counts towards the RRE (“Reuse/Refill/Elimination”) floor. In 2032, however, Reuse/Refill and Elimination count towards the floor. In all of the years, the other pathways only count towards the remainder of the target requirements – never towards the RRE floor.
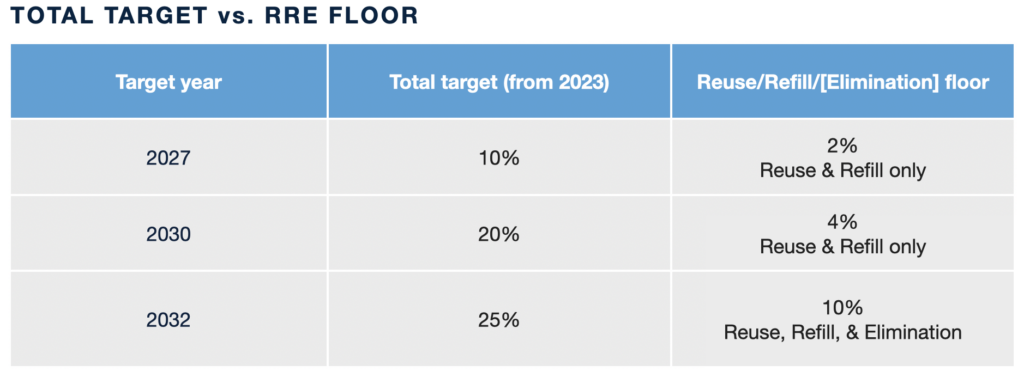
Figure 1. SR Target vs. RRE Floor for each target year
Why does elimination only join reuse/refill in 2032? While this question isn’t explicitly answered by the state, we have our own theory. California treats reuse/refill as the gold standard for source reduction because it takes real infrastructure investment to build those systems. So, for the early target years, the legislation reserves the reuse/refill floor exclusively for reuse/refill to spur early investment in those systems. By 2032, elimination is recognized as reaching the same SR tier and counts towards RRE alongside reuse/refill.
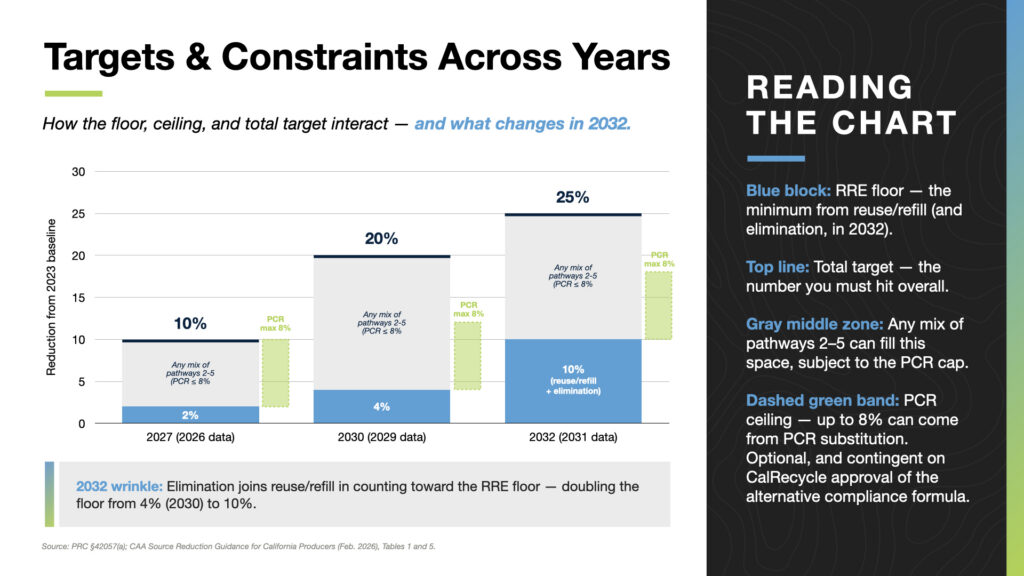 Figure 2. Targets and Constraints Across Years
Figure 2 visualizes all three SR target years, incorporating the RRE floor as well as the 8% PCR ceiling. There are several key takeaways to gather from this chart. First, as mentioned previously, the PCR ceiling is a flat 8% across all years. Unlike the RRE floor, it does not grow with the target. This means that once a producer reaches the 8%, additional PCR incorporation cannot count towards their overall SR goals. What does this mean for each target year?
In 2027, a producer could reasonably hit the 10% SR target by exhausting the 8% PCR ceiling and meeting the 2% minimum reuse/refill floor. In 2030, however, using the 8% PCR ceiling and meeting the 4% reuse/refill floor only gets producers to a 12% total source reduction. In this scenario, you’re still short by 8%, meaning that real work on packaging design using the other three pathways is necessary to close the gap. In 2032, we see a similar situation – using the 8% PCR ceiling and meeting the 10% RRE floor gets you to 18% total source reduction, leaving a 7% gap that will have to be closed using non-PCR work. Again, that will require the use of the remaining three pathways to get back on track.
In Figure 2, you’ll notice that the PCR ceiling is anchored above the green RRE floor. This is intentional, as PCR cannot serve as a substitute for the RRE minimum; this must be met by reuse/refill/elimination alone. Additionally, whereas the PCR pathway is optional, the RRE minimum is not, and producers must meet this minimum target every time. In 2032, the RRE floor jumps from 4% to 10% once elimination joins reuse/refill as counting towards the floor. This is a significant jump that producers should be planning for far ahead of time.
Source Reduction Strategies that Do and Don’t Work
Many of the conversations around source reduction focus on primary packaging, but this is one of the most difficult spaces to source reduce. In our experience, secondary, and especially tertiary packaging provide great opportunities for source reduction through relatively simple and cost-effective changes. Let’s take a look at a real-world example.
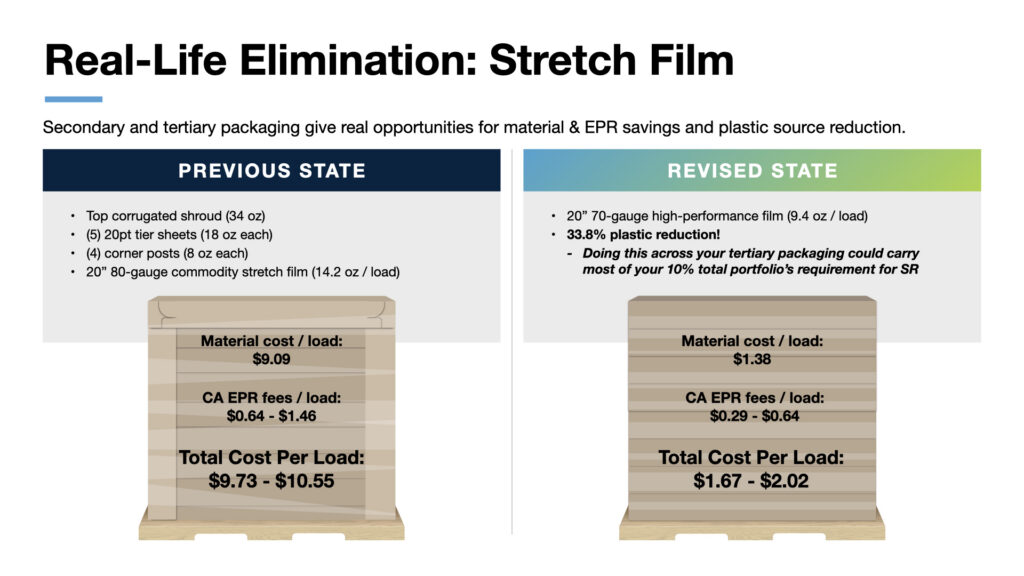 Figure 3. Real Life Example of SR Through Stretch Film, using California’s Illustrative Fee Schedule as of May 2026
Figure 3, shown above, shows a pallet of laundry detergent that Atlantic reconfigured for a real customer. When the customer came to us, they were using a top corrugated shroud, multiple tier sheets, corner posts, and an 80-gauge commodity stretch film; that’s a lot of material for one pallet, and a lot of different components to report and pay EPR fees on. We were able to reconfigure the entire design using only a single 70-gauge high-performance film, resulting in better containment and a huge reduction in material.
This redesign resulted in major material cost and EPR savings. In its previous state, the material costs alone were $9.09 per pallet. Once you incorporate California’s illustrative fees, EPR fees per pallet would range from $0.64 to $1.46, bringing the total cost per pallet to $9.73–$10.55. In the revised state, the material costs dropped to $1.38 per pallet. With the EPR fees included, the total cost per pallet would range from $1.67–$2.02. But the highlight from a California plastic source reduction point of view is the huge decrease in plastic usage: going from 14.2 ounces per load to just 9.4 meant a 33.8% reduction in single-use plastic for this configuration. While only the decrease in plastic material affects compliance with plastic SR requirements in California, this redesign also resulted in overall material savings, and EPR savings for other components too.
This example shows how important the consideration of secondary and tertiary packaging is when developing strategies to meet SR requirements. Producers can use reductions in these areas to balance out other areas of their portfolios that are harder to source reduce, such as primary packaging. Since California tallies a producer’s plastic in aggregate across the whole portfolio, finding areas to majorly source reduce in a handful configurations could mean that other changes aren’t necessary elsewhere. Increasing efficiency across your tertiary packaging through actions like the ones shown in the example could carry most of your 10% SR requirements for 2027, which is why we emphasize tertiary packaging as a great space to start finding low-hanging fruit in EPR savings. Elimination like this is a great way to make real reductions, but let’s also look at a few strategies that don’t work as well.
One strategy that can’t take producers very far is transitions to alternative plastics, specifically compostable and bio-based plastics. As plastic is defined in SB 54, most compostable and bio-based resins are still considered plastic. In fact, California’s statutory definition of “plastic” explicitly includes PLA and other bio-polyesters. This means that switching from a fossil-fuel based plastic, such as polypropylene or polyethylene, to a bio-based plastic like PLA will not earn producers any source reduction credit.
There are several other actions that may look like reductions, but will not earn producers any source reduction credits. First is transitioning from a recyclable format to a non-recyclable format. For example, a producer may try to switch from a heavy, rigid PET bottle to a lightweight multilayer film pouch as a form of lightweighting. This kind of change is specifically excluded from earning SR credit because you’ve gone from a recyclable format to a non-recyclable format, and SB 54 explicitly excludes from the “lightweighting” pathway any change that makes the material less likely to be recycled or composted.
Another action that does not earn SR credit is transitioning from one plastic resin to another, even if that resin is more recyclable. For example, switching from PP to PET is not considered material switching under switching to a non-plastic material, as the plastic component is still there. Lastly, actions that reduce material use of non-plastic materials will not be counted. For example, eliminating a non-plastic component (fiber-only label, paper insert, etc.) or implementing reuse/refill for non-plastic items would not count. This is because source reduction in California is measured against your plastic baseline, so reducing what wasn’t in that baseline to begin with doesn’t move the number.
Producer Requirements
What exactly do producers need to do in California this year (2026) since source reduction introduces more reporting requirements? May 31st, 2026, was a big reporting deadline for producers in all active EPR states, but California’s SR requirements add even more reporting obligations. As with other states, producers needed to submit an Annual Producer Supply Report, in this case for calendar year 2025 data, which detailed the weights of all covered material categories used that year. But unlike other states, producers in California also were required to specifically report the weight and number of plastic components used as part of that report. This plastic-specific reporting will be required annually going forward.
At the same time, producers were required to submit a finalized Source Reduction Baseline Report, which details the baseline supply data from calendar year 2023. This information was formally locked in as the true baseline for all source reduction activity.
Alongside their Annual Producer Supply Report, all obligated producers in California must submit an Annual Source Reduction Report, which tracks reduction activity against that 2023 baseline. This report requires producers to disclose how much plastic they eliminated via each of the five pathways and explain their efforts in each.
Lastly, producers must also submit a one-time Individual Source Reduction Plan (ISR) – a forward-looking strategy for hitting the 2027, 2030, and 2032 targets. This ISR, due August 1, 2026, becomes a binding agreement with CAA.
Understanding how source reduction accountability is divided between CAA as the PRO and individual producers is one of the more nuanced aspects of the program. Ultimately, the numeric SR targets in the law – 10% by 2027, 20% by 2030, and 25% by 2032 – are formally CAA’s obligations as the PRO, measured against the aggregate plastic supply of all registered producers combined. CAA does not impose these same percentage targets directly on individual producers. Instead, each producer is required to submit their ISR Plan declaring what reductions they intend to make, and then enter into an enforceable ISR Agreement with CAA formalizing those commitments. In other words, the numeric obligation starts as self-declared, with producers setting their own targets, but those targets become legally binding once the ISR Agreement is signed.
This prompts the question – if producers can set their own individual SR targets, how are the aggregate targets enforced? The practical incentive mechanism is financial, not regulatory. In the California Source Reduction Incentive Mechanism Guidance, released May 1, 2026, CAA has designed a bonus/malus system that incentivizes producers financially to achieve ambitious SR, even beyond what they may have targeted. Producers that achieve source reduction earn bonuses, structured in two tiers. Tier 1 pays a bonus on reductions measured against a producer’s 2026 supply, not 2023. This rewards producers who have already reduced plastic since 2023 but haven’t yet gone below the 2023 baseline. Tier 1 is structured to reward giving back growth that occurred between 2023 and 2026. Tier 2 pays a higher bonus on reductions below the 2023 baseline (i.e., true net source reduction toward the SB 54 targets).
In addition to the two-tiered bonus system, CAA has offered two other stackable bonuses – a PCR bonus, and a reuse bonus. The PCR financial incentive will take the form of a per-pound bonus on APR-certified PCR used above a producer’s 2023 baseline, payable each year it is used. Although PCR contribution towards the total SR targets is capped at 8%, CAA will not cap individual producer PCR bonus eligibility at 8%. This means that producers have a financial incentive to incorporate PCR content beyond the 8%, even if it won’t contribute towards SR targets. Bonus rates for PCR content vary by resin type, with illustrative rates ranging from $20/ton (HDPE Natural) to $1,200/ton (Mono PP Flex) (see figure 4).
Producers that fail to reduce their plastic supply are subject to a malus fee applied to every pound of plastic they supply into California. That malus is designed to increase over time as more producers claim bonuses, since the system is revenue- neutral: in other words, the malus fees from producers who don’t source reduce enough will subsidize the bonus fees of producers who source reduce more. CAA has modeled that if producers collectively achieve the 2032 targets, the malus could reach $500–$700 per ton – a meaningful cost signal for producers who choose not to act. The bottom line for individual producers is this: while CAA bears the statutory liability for aggregate target achievement, every producer faces real and escalating financial consequences for failing to meet the commitments made in their ISR Agreement. The incentive mechanism effectively converts what is nominally a collective obligation into individualized financial accountability which will only intensify as the program matures toward 2032.
While the final bonus/malus fees have not been decided as of this publishing (June 2026), CAA published an illustrative 2027 Incentive Mechanism Schedule that provides examples of what incentive levels could be in 2027 (see figure 4 below). These are not the final incentive amounts that CAA will implement as part of its program in 2027 – they are simply intended to help producers complete their ISR Plans. The official schedule will be released by CAA in October 2026, alongside the fee schedule. It’s important to note that the incentive mechanism is not static, and CAA will update incentive values every year in October to reflect the actions producers have taken and CAA’s progress towards the targets.
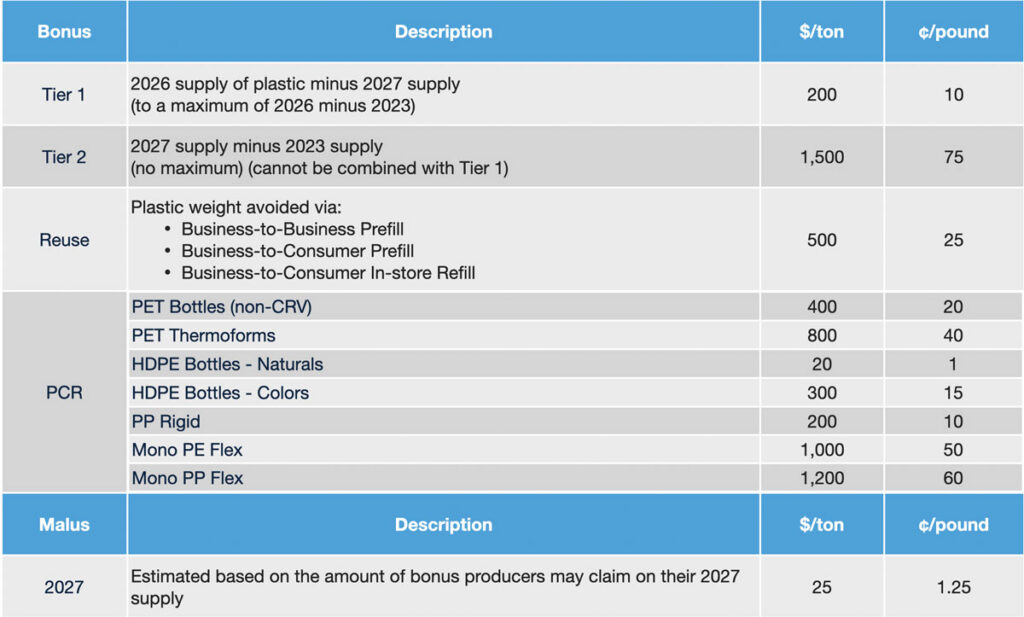 Note: This Incentive Mechanism Schedule is as of the May 1st release of Version 1.0 of this guidance
Conclusion
California’s SB 54 source reduction requirements represent a fundamental shift in how producers must think about single-use plastic packaging — one that goes well beyond recycling rates and even EPR fee payments. Meeting the 10%, 20%, and 25% targets across 2027, 2030, and 2032 will require deliberate, multi-pathway strategies that balance the RRE floor, the PCR ceiling, and the hard reality that sales growth offers no relief from an absolute baseline. And with CAA’s bonus/malus incentive mechanism now published, the financial stakes for inaction are real and will only grow as the program matures. Producers who start early, document carefully, and build source reduction into their packaging design process will be far better positioned than those who wait.
We’ve been helping customers identify and execute source reduction opportunities across their packaging portfolios, and in our experience, tertiary packaging is consistently the most accessible place to start. As the stretch film example in this piece illustrates, relatively straightforward redesigns in secondary and tertiary packaging can generate meaningful SR credit, significant material cost savings, and lower EPR fees — all at the same time. If you’re trying to figure out where your portfolio stands and where your lowest-hanging fruit is, our team is ready to help you work through it.
Where to go from here?
- Download the CA Source Reduction Requirements Quick Reference Guide
- Access our Inside EPR Webinar Series
- Visit our library of all our Deep Dives articles here
- Check out our Sustainability Terms Glossary, where we’ll add key terms from each of our Deep Dives over time.
- Sign up for our Deep Dive LinkedIn Newsletter and get these articles delivered straight to your inbox every month.
- Bookmark these pages for future reference!